HTML Report Generation Example🔗
Below is code for a custom function that uses Plotly, Pandas and Dominate to generate a HTML report.
import io
import dominate
from dominate.util import raw
from dominate import tags as tags
import numpy
import pandas
import plotly.express as px
import seaborn
def signature():
return {
"version": "0.0.1",
"name": "HTML report generation",
"description": "Generates a HTML report with interactive plot and table data.",
}
def run(upload_custom_artifact):
s = io.StringIO()
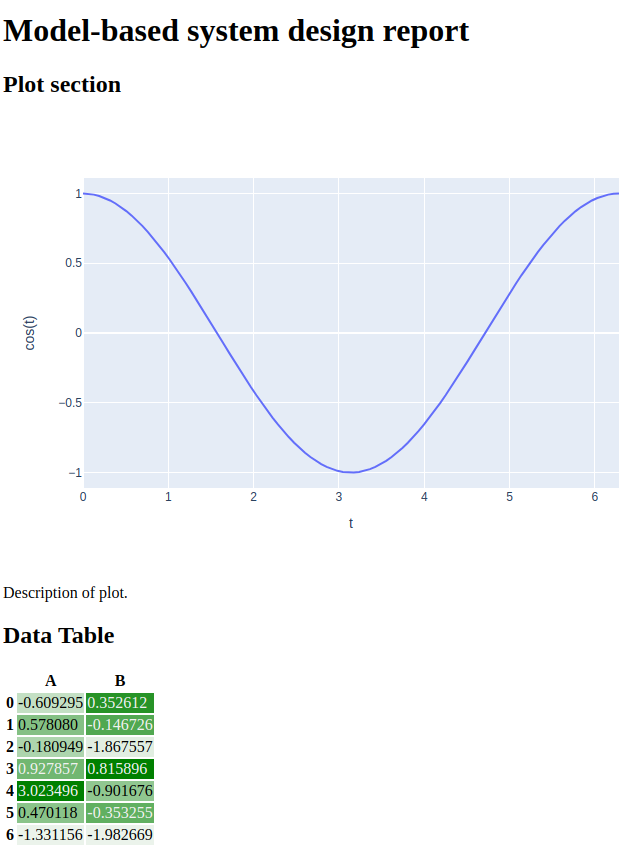
t = numpy.linspace(0, 2*numpy.pi, 100)
fig = px.line(x=t, y=numpy.cos(t), labels={'x':'t', 'y':'cos(t)'})
fig.write_html(s)
s.seek(0)
df = pandas.DataFrame({'A': numpy.random.randn(7), 'B': numpy.random.randn(7)})
cmap = seaborn.light_palette("green", as_cmap=True)
df = df.style.background_gradient(cmap=cmap)
doc = dominate.document(title='My HTML Report 😃')
with doc.head:
tags.style("body{ margin:0 100; }")
with doc.body:
tags.h1("Model-based system design report")
tags.h2("Plot section")
raw(s.read())
tags.p("Description of plot.")
tags.h2("Data Table")
raw(df.to_html())
html_report_file = "file.html"
with open(html_report_file, 'w') as f:
f.write(doc.render())
artifact_route = upload_custom_artifact("html_report", html_report_file)
print('HTML report can be viewed @artifact[here]({})'.format(artifact_route))
The generated report viewed in a browser will look as: