Fuel Consumption🔗
Flight mission fuel extraction🔗
This section is about observing the temperature and pressure evolution in the tanks when considering the changing ambient heat ingress based on altitude and the flow rate of liquid fuel extraction for the required propulsion for a flight mission. We will define boundary conditions for the tank based on a flight profile and use the prior models to quickly get new experiments running.
Overview🔗
- Setup system boundaries.
-
Analyze tank conditions when fuel is extracted from the tank during flight with heat ingress.
-
Foam vs Vacuum.
-
Required pressure regulation
- Pressure release if the tanks get too hot.
- Heating if tank pressure is too low to avoid air leakage.
-
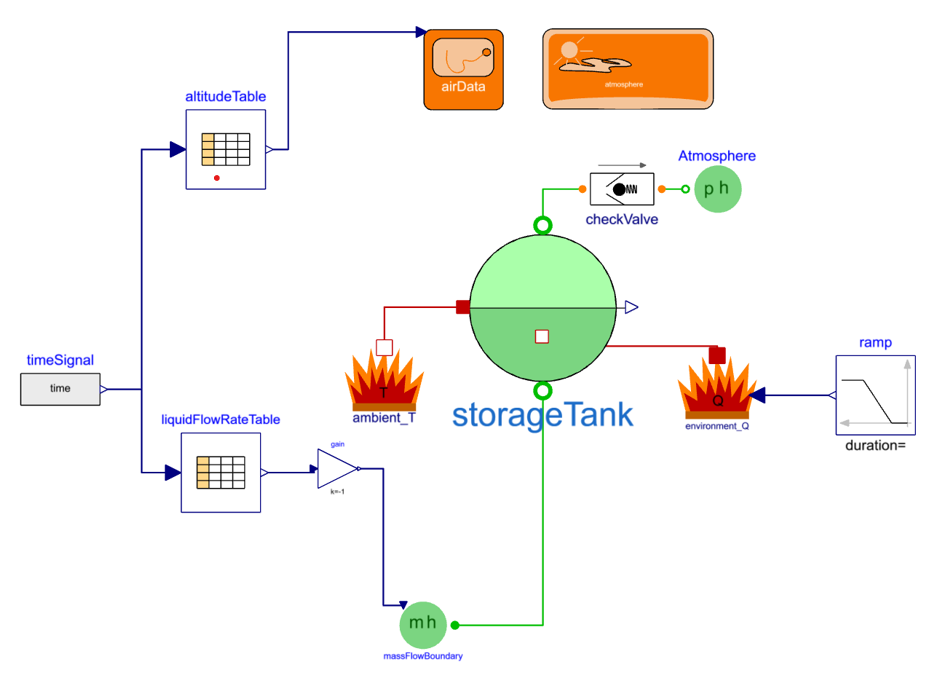
System Setup🔗
-
Duplicate Workspace.Experiments.TankPressurization model and name it as FlightRangeBase. This will carry over the Experiment definitions and views already set up.
-
Delete the altitude and timeTable source blocks and revert the values for the ramp connected to the environment_Q so no heat is added to the liquid.
-
Drag in the following components and connect them as shown below.
- Modelica.Blocks.Sources.RealExpression as timeSignal.
- Modelica.Blocks.Tables.CombiTable1Ds as altitudeTable.
- Modelica.Blocks.Tables.CombiTable1Ds as liquidFlowRateTable.
- Modelica.Blocks.Math.Gain as gain.
-
The inputs for altitude and fuel flow rate are supplied by tables stored on .txt files. Set the following parameters in the ComiTable1Ds blocks.
-
altitudeTable
- tableOnFile = true
- tableName = “Altitude”
- filename can be set by dragging the .txt from the resource folder into the input field.
- extrapolation = Hold the first/last table point outside of table scope
-
liquidFlowRateTable
- tableOnFile = true
- tableName = “FuelFlow”
- filename can be set by dragging the .txt from the resource folder into the input field
- extrapolation = Hold the first/last table point outside of table scope
-
-
The table expects time in seconds, so for the input signal - timeSignal parameter is set as y = time.
- The output from the fuel flow rate table will be a positive flow rate. In order to extract fuel from the storage tank the signal needs to be reverse, so set gain.k = - 1.
-
In the inherited experiment definitions of Foam232 and MLI232, we will keep the modifiers for the initialization and geometry as they are. But in order to simulate the entire flight mission profiles in the table data to be used, change the stopTime for both experiments to 36,000 seconds with an interval of 72 seconds.
Test setup🔗
The foam tank and vacuum tanks will use different files will be used for the altitude and fuel flow so separate test models will be prepared for each. The filename cannot be modified with the Experiment definitions.
- Download and Import the MLI232 and Foam232 folders into the Workspace.Resources folder. These will each contain a FuelFlow.txt and Altitude.txt.
Foam test model🔗
-
Create a new model named FlightRangeFoam232 by extending from the Workspace.Experiments.FlightRangeBase model.
-
For altitudeTable.filename, drag the Workspace.Resources.Foam232.Altitude.txt into the input field.
-
For liquidFlowRateTable.filename, drag the Workspace.Resources.Foam232.FuelFlow.txt into the input field.
-
By extending from the FlightRangeBase model this model inherited the experiment definitions. Now that the altitude and liquid flow rate tables have been set with the Foam232 data. Select the Foam232 experiment.
-
Simulate and then enable the ‘Result’ view.
-
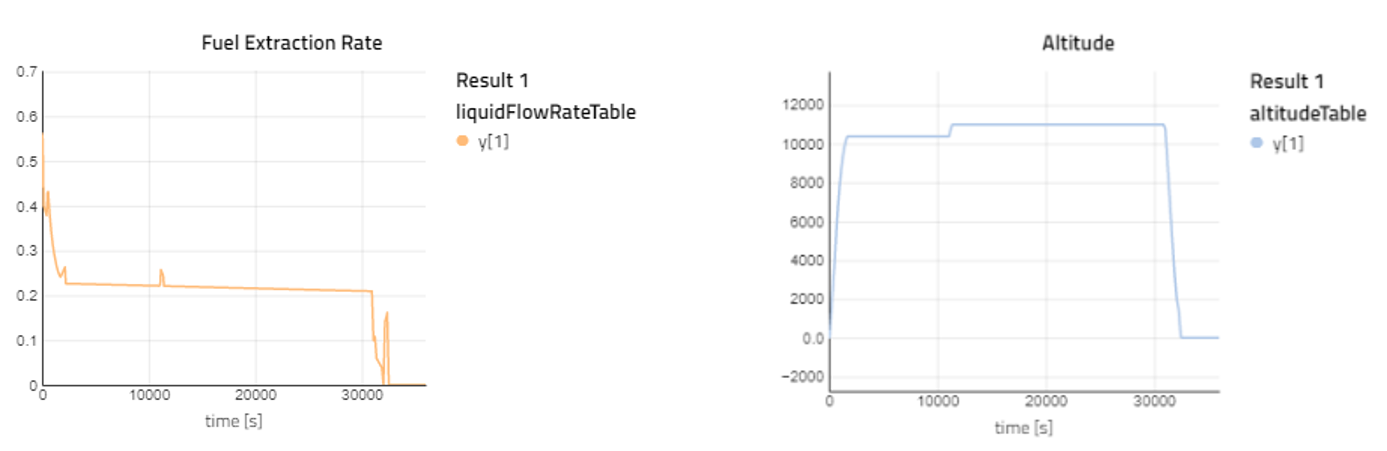
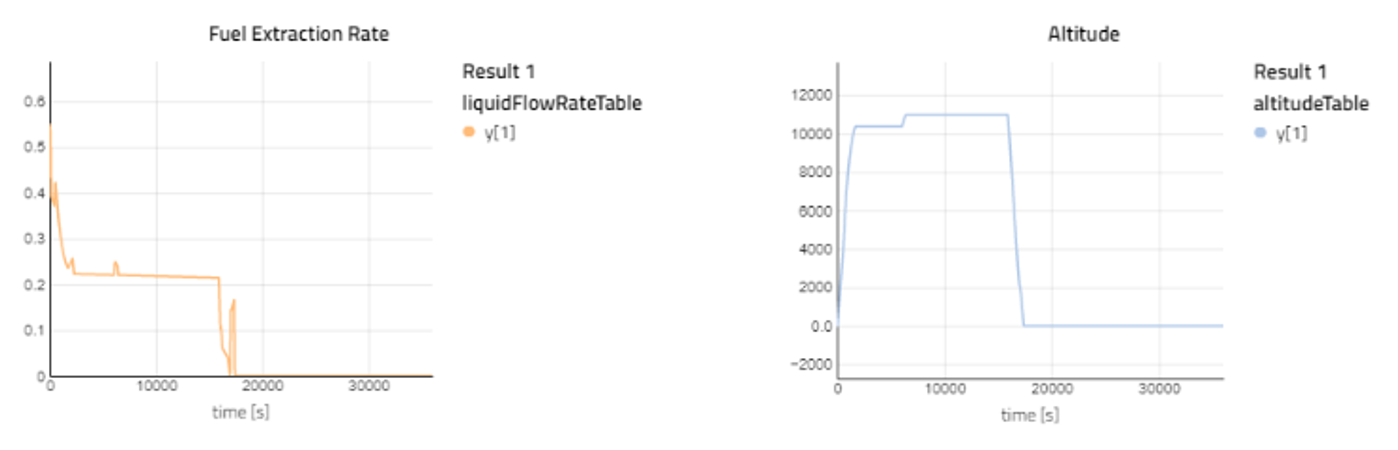
Plot altitudeTable.y for the altitude and liquidFlowRateTable.y for the rate of fuel extraction. Go to Views and save this unsaved view as “FlightResults”.
Vacuum test model🔗
-
Duplicate Workspace.Experiments.FlightRangeFoam232 to create a new model for the MLI tank called FlightRangeMLI232. This will bring over the ‘FlightResult’ view just created.
-
For altitudeTable.filename, drag the Workspace.Resources.MLI232.Altitude.txt into the input field.
-
For liquidFlowRateTable.filename, drag the Workspace.Resources.MLI232.FuelFlow.txt into the input field.
-
Select the MLI232 experiment, simulate it, and use the “FlightResults” view.

Observations🔗
-
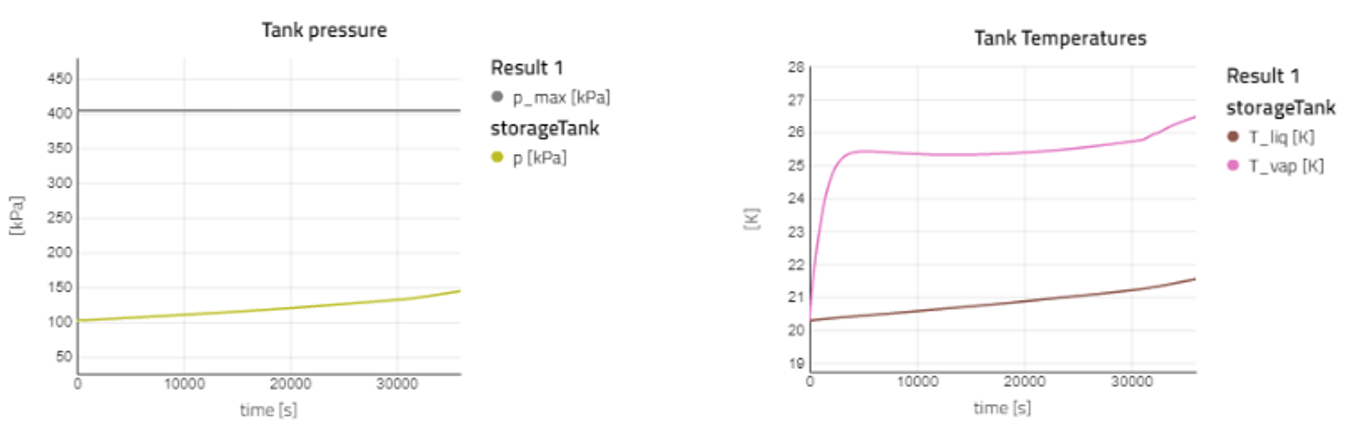
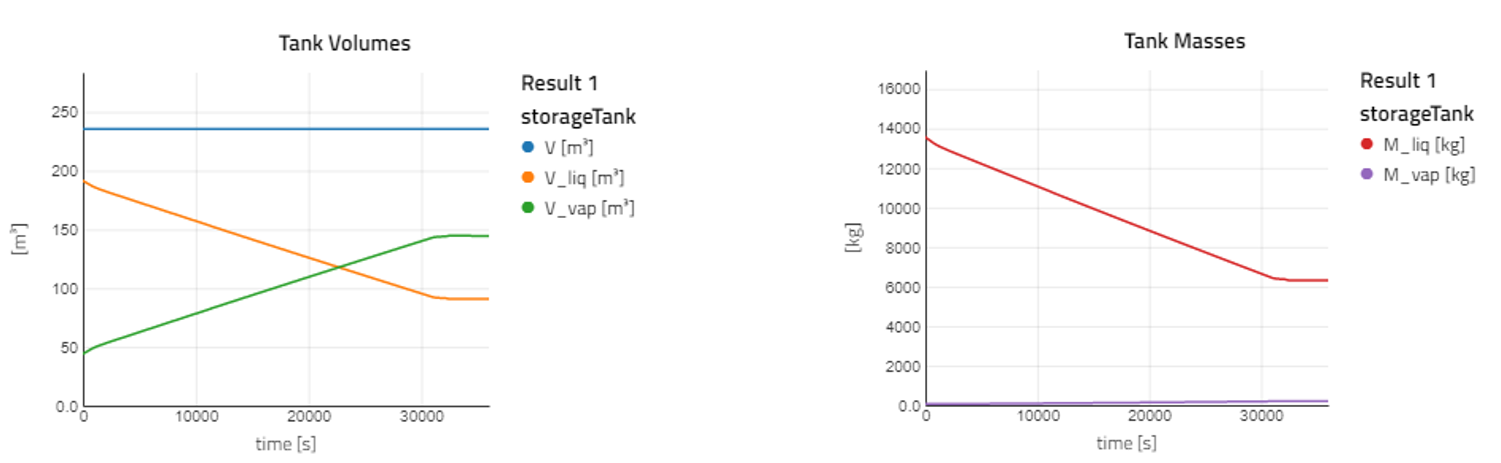
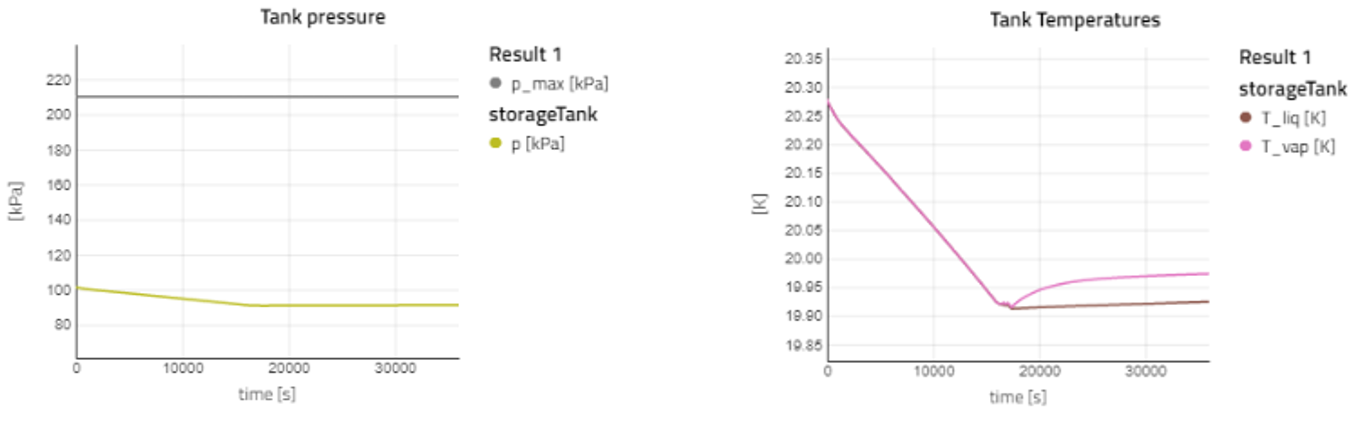
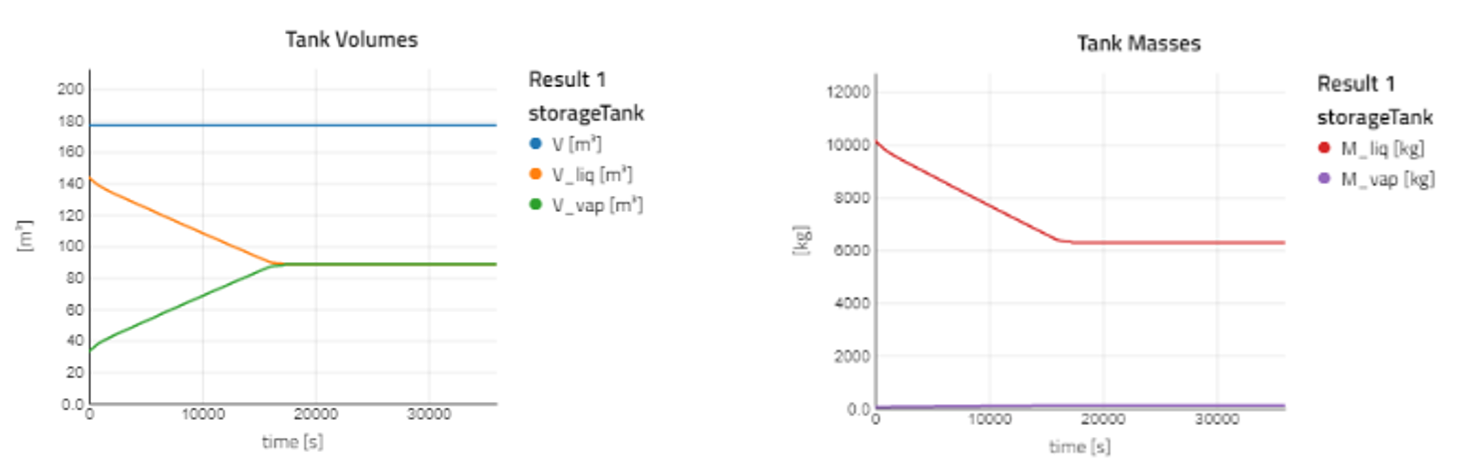
Foam 232 :
- Similar to the storage scenario the liquid and vapor temperatures steadily rise.
- Liquid mass decreases during extraction and pressure rises due to temperature increase.
-
MLI232 :
- The pressure and temperature decrease during fuel extraction.
- Due to very low heat ingress and the volumetric expansion of the gas while only liquid is being extracted, the rate of evaporation is low and the expansion is almost enthalpic.
- For this tank, adding heat to the liquid with environment_Q can prevent pressure from dropping below ambient to avoid leakage. This pressure level for the tank design is in no danger of buckling.
Suggestion🔗
- Test various Qflow0 for the environment_Q to see how additional heat sources from electronics intentionally or unintentionally affect the pressure and temperature evolution for the foam and MLI tanks.
- Define your tables for altitude and fuel flow rate.
Congratulations, you have completed the Hydrogen Storage Tutorial!