Get Started with the Excel Add-in🔗
This tutorial provides a step-by-step guide for setting up your first example using the Modelon Impact Add-In for Excel. By following this tutorial, you will learn how to:
- Run a simulation in Modelon Impact to use as a base for experimentation in Excel
- Download an Excel worksheet to set up experiments with the Excel add-in
- Configure the experiments to run in Excel
- Execute the experiment and fetch the results.
Before you start🔗
Before you begin, make sure you have the Modelon Impact Add-In for Excel installed. Also please note that the add-in is installed separately for Excel desktop and Excel for the web. If you want to have access to the add-in in both versions you need to install it to both.
Your first experiment🔗
Throughout this tutorial, we will work with a basic example model from the Modelica Standard library, "Modelica.Blocks.Examples.PID_Controller", in order to illustrate the general workflow. Naturally, the same workflow can be applied to any other model as long as the appropriate adaptions are made.
Download the template file🔗
Launch your web browser and log in to your Modelon Impact Cloud Account. Open a new workspace or an existing one containing the model you wish to work with. In our example, we will be using the model "Modelica.Blocks.Examples.PID_Controller" from a workspace named "ExcelDemo".
Simulate the model you want to use in Modelon Impact. This simulation will be use as a baseline for experimentation in Excel.
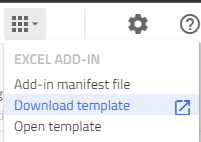
When the model is successfully simulated, open the Apps menu and select "Open template" (which opens the template in Excel desktop) or "Download template".
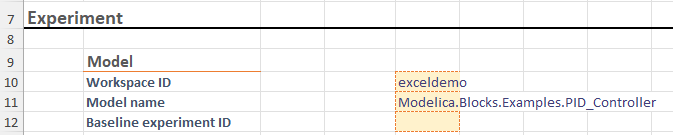
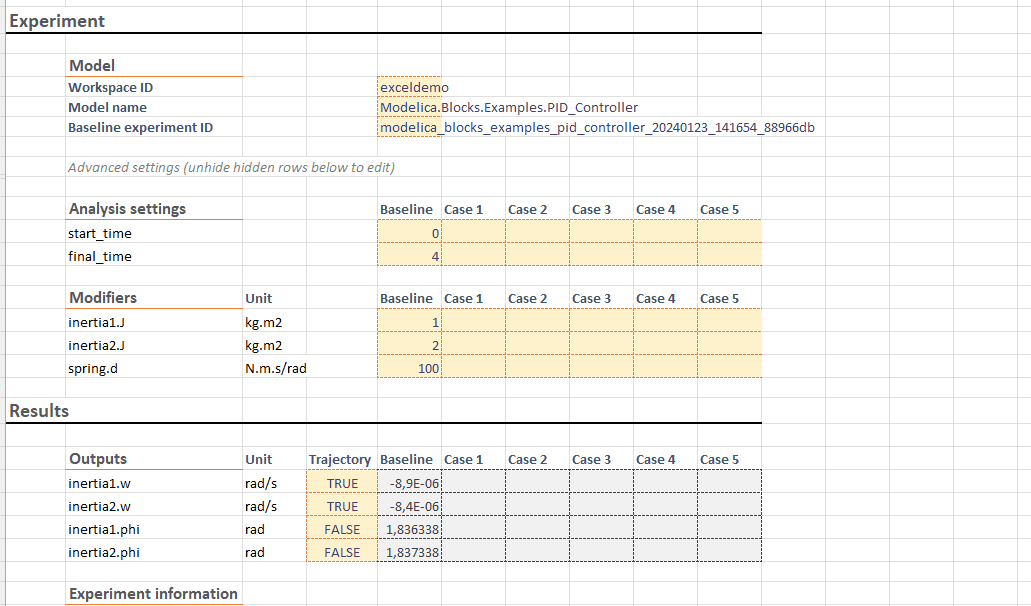
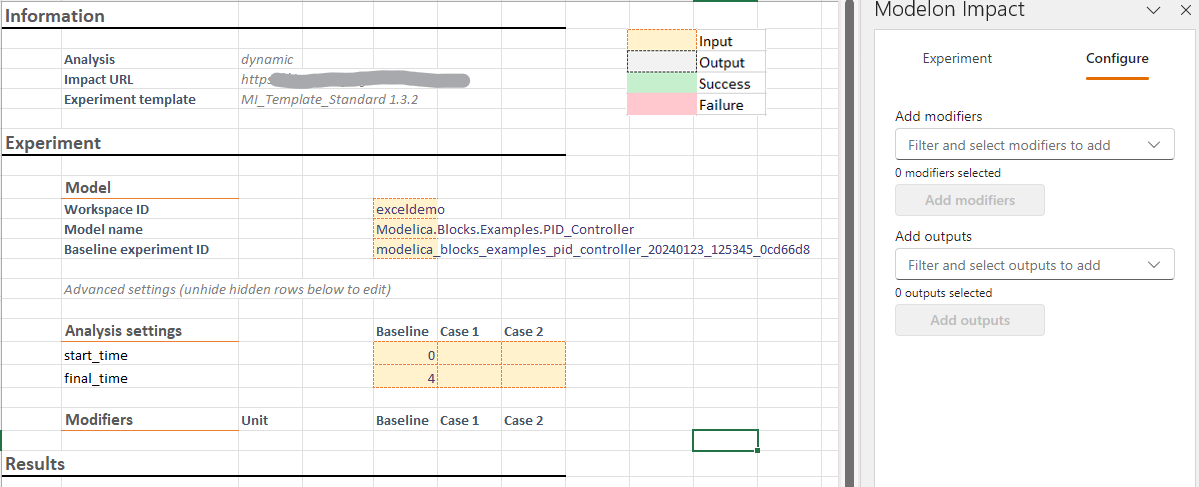
Open the template Excel file and go to the "ModelonExperiment" worksheet. Verify that the sheet contains the model name and workspace id. The cell Baseline experiment id should be empty (this cell will be filled by the add in once a baseline result is selected in the next step).
The workspace id is in general an all lower case version of the workspace name (see more in the section Workspace ID and Model Name).
Launch the Modelon Impact Add-in🔗
If installed correctly, the add-in should be accessible from the "Home" tab.

To open it, simply click the Modelon Impact logo. This will open the add-in to the side of the screen.
Authenticate🔗
To use the add-in we need to authenticate in Modelon Impact. Click the "Login" button and provide your Modelon Impact Account credentials in the pop-up window.

Select baseline result🔗
After successful authentication the add-in will display the setup view, where a result to use as a baseline can be selected.
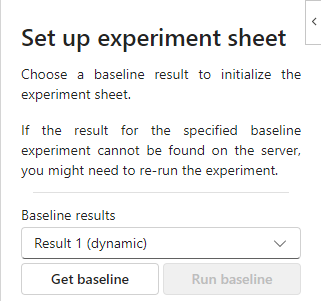
Select a result to use as a baseline from the dropdown list, and click "Get baseline". This will fetch all the information needed to reproduce the result to the sheet in Excel, and the add-in will change to Experiment/Configure mode.
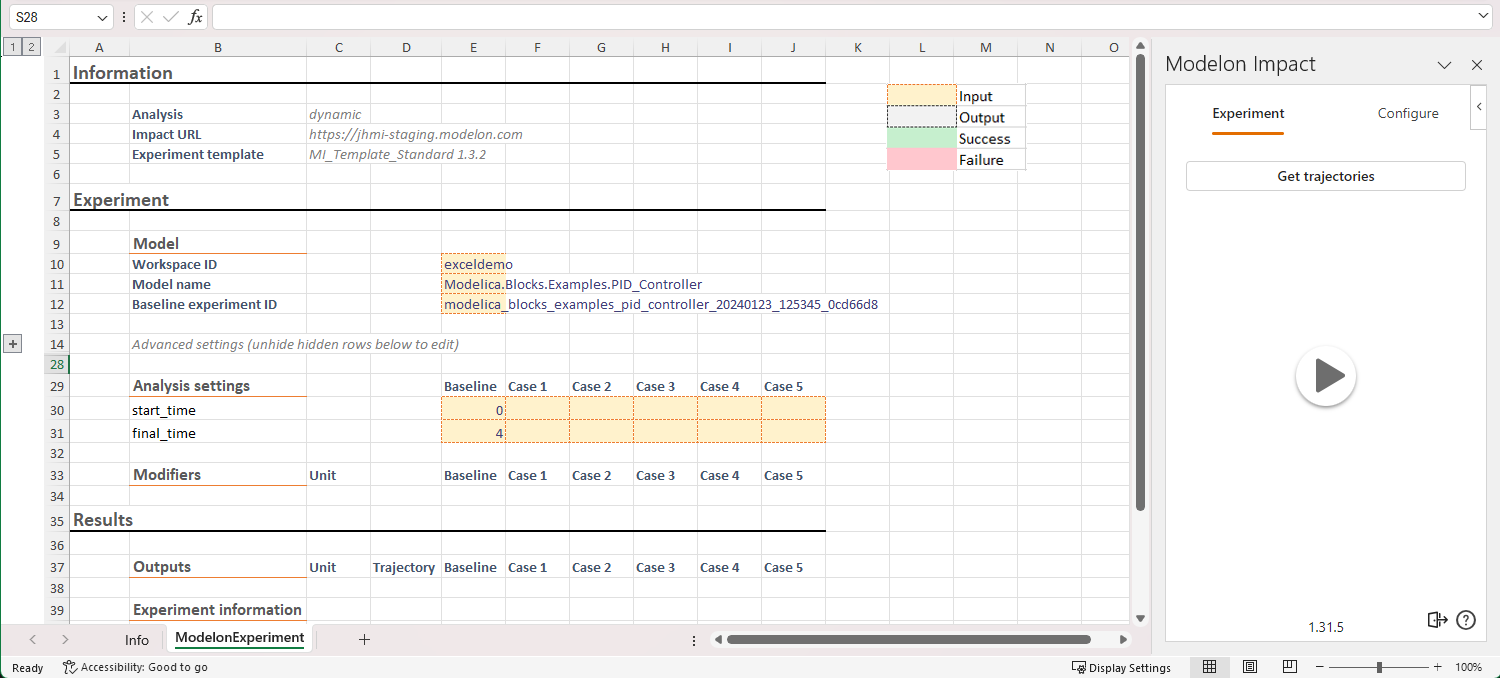
Setting up and running experiments🔗
In order to execute an experiment we need to provide the following information:
- Workspace ID and Model Name (Model)
- Cases to execute
- Analysis settings
- Model Parameters (Modifiers)
- Output Variables (Outputs)
All this information should be present in the "ModelonExperiment" worksheet in order for the add-in to be able to run a simulation.
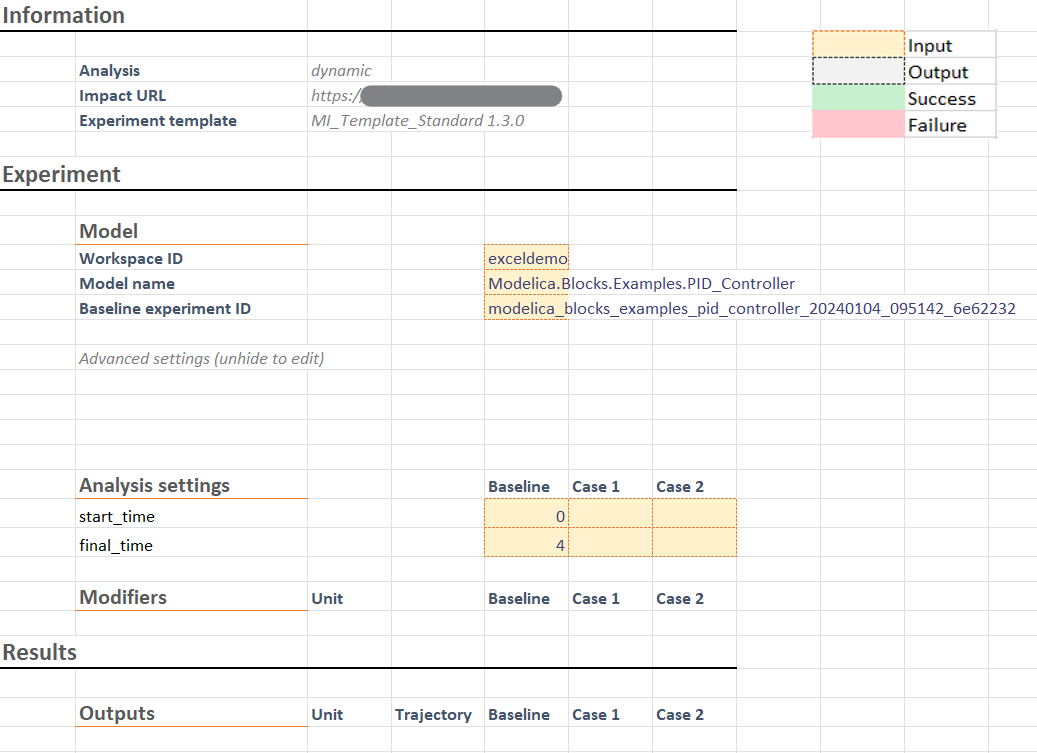
The template worksheet also contains other information such as version info and run information from executed experiments.
Important
The add-in retrieves the experiment's information by referring to specific markers in the file, such as "Modifiers" and "Outputs". Hence, it is highly recommended to make modifications to the template worksheet only as outlined in this documentation.
Workspace ID and Model Name🔗
If you opened/downloaded the template file while having a specific model opened, the worksheet should already have been filled out automatically to use that specific model.
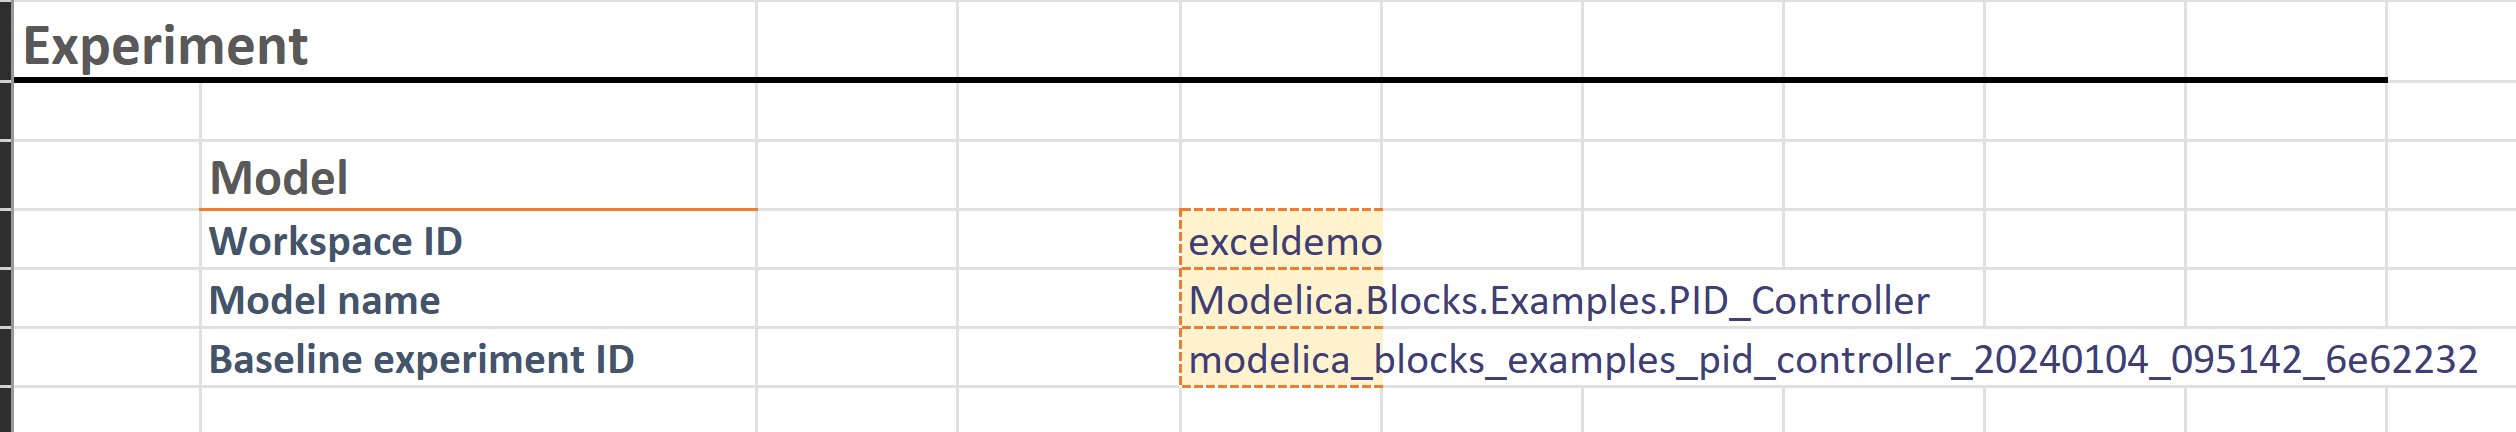
If the template was generated from the landing page, or you want to change the workspace to use, this information can also be filled in manually in the Excel worksheet.
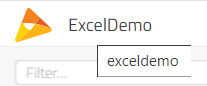
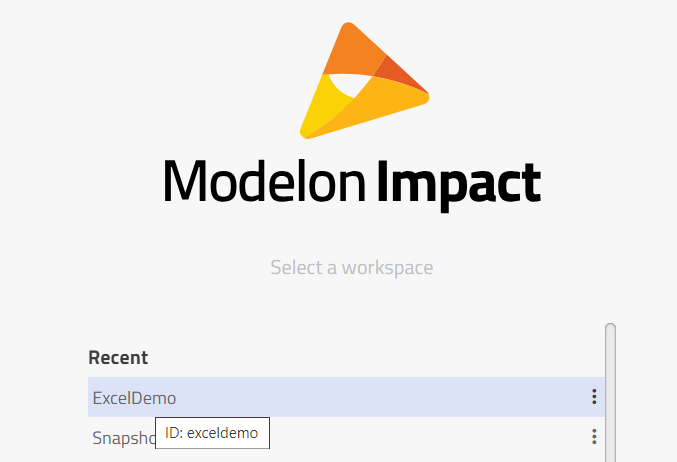
The workspace id can be found in the tooltip of the workspace name in Modelon Impact, on the workspace selection page, or from the URL of the Impact workspace (.../workspaces/<workspace name>/...) and is in general an all lower case version of the workspace name.
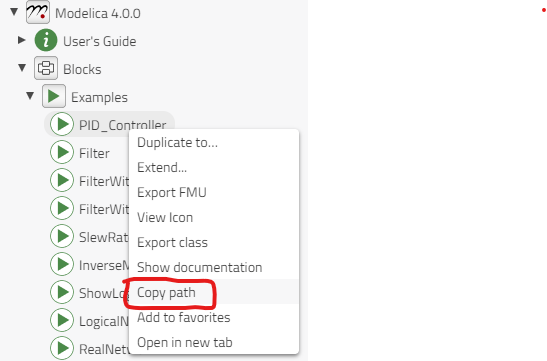
For the model name, you can get the correct model name by right clicking the model in the library browser and choose "Copy path".
For our example the correct Workspace Id is exceldemo and the Model Name is Modelica.Blocks.Examples.PID_Controller.
Adjusting the number of cases🔗
A case in an experiment is a simulation of the model done with a certain set of parameters that would yield a certain output. Each case is represented by a column. The template worksheet is by default set up to run 5 cases. To adjust the number of cases to run, we can simply add or remove columns to achieve the appropriate amount of cases.
Adding cases:
Removing cases:
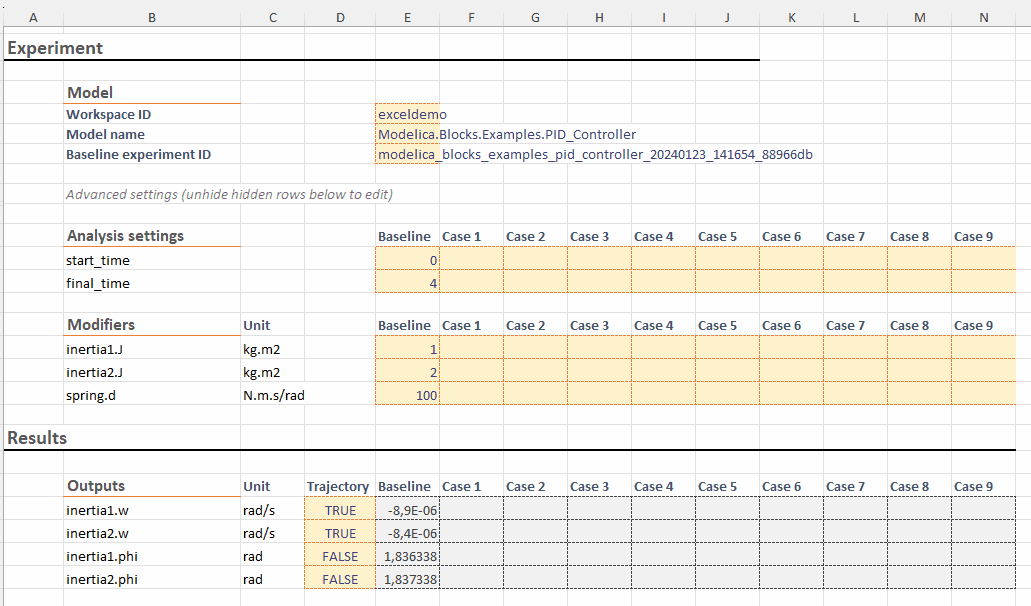
In our example we will consider two cases.
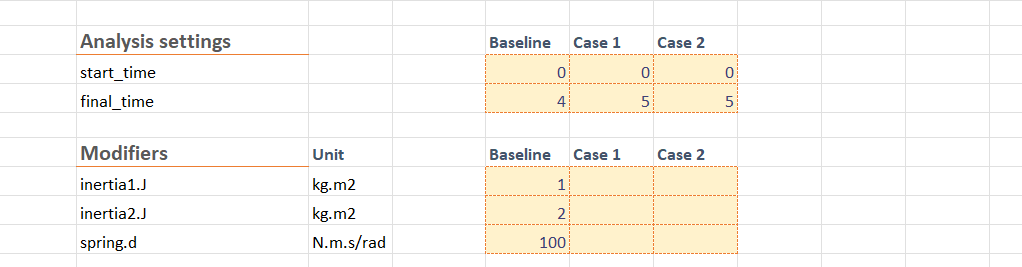
Analysis settings🔗
Under "Settings" in the template worksheet, the analysis parameters for the simulation to run (dynamic/steady-state/custom) are listed. For dynamic simulations, these are:
start_timefinal_time
These settings needs to be filled out for every individual case. Start time and final time are given in seconds.
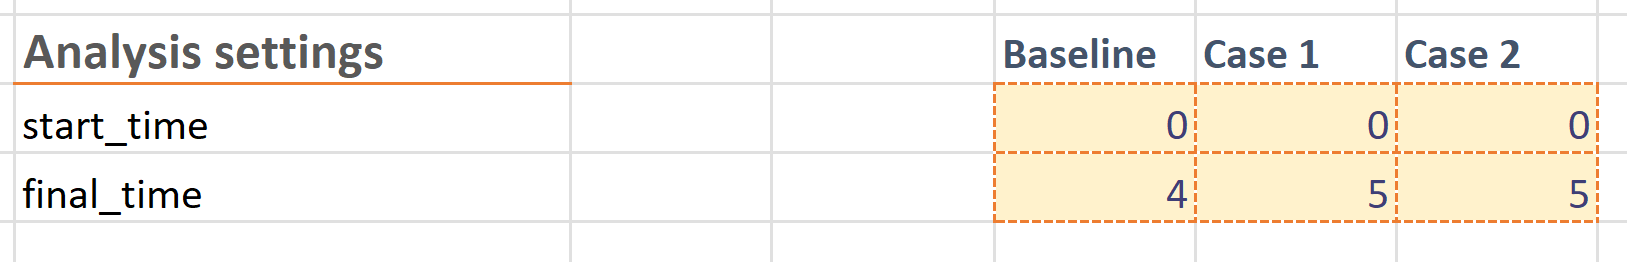
In this case we have defined two cases which will each run from 0 to 5 seconds.
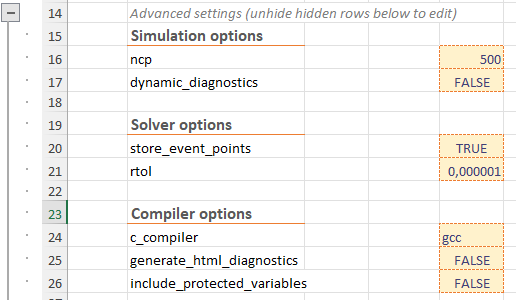
Custom simulation, solver and compiler options can also be set by expanding the "Advanced settings" sections in the worksheet. These options are used for all cases, and don't need to be modified unless you want to change something compared to what was used in the baseline simulation.
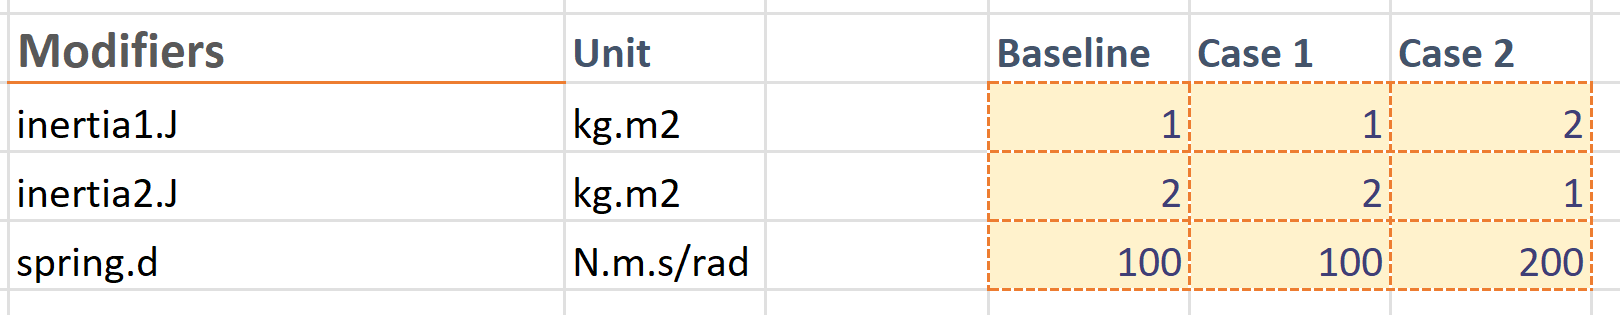
Model parameters (Modifiers)🔗
To study the effect on the result when changing a specific model parameter, we can add modifiers and outputs to the sheet using the "Configure" mode of the Excel add-in. To open configure mode, click the "Configure" tab in the add-in (right sidebar). This shows a user interface where modifiers and outputs can be added to the sheet.
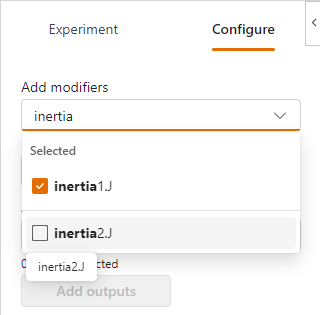
Use the input dropdown to add parameters to the sheet, e.g. the parameters inertia1.J, inertia2.J and spring.d for the PID controller example. Parameters are added by searching for the name in the search bar 'Add modifiers', adding the variables of interest by checking the checkbox, and clicking "Add modifiers" when done. The parameters are then added as new rows in the sheet and their units are shown, as well as their values in the baseline simulation.
Add values to the modifiers for the different cases, e.g. like below for the PID controller example.
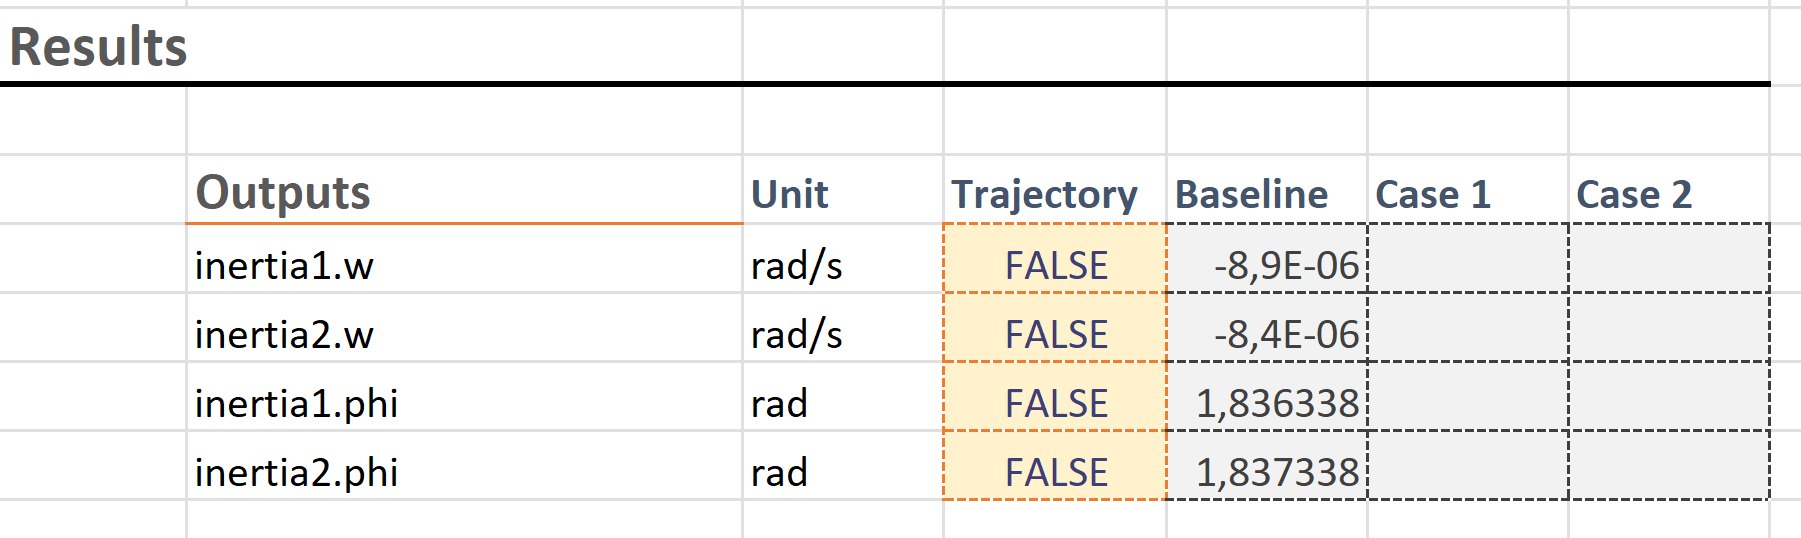
Output variables (Outputs)🔗
Now we have added all information needed in order to run the experiment. However in order to analyze the result we also need to specify what variables from the simulation results we want to fetch back to the Excel worksheet. This is specified in the Results group under "Outputs". Similarly to the modifiers, these are added through the dropdown in the Configure pane.
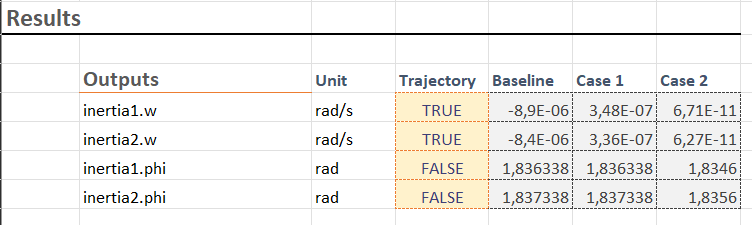
Use the dropdown "Add outputs" to add output variables to the sheet, e.g. the parameters inertia1.phi, inertia1.w, inertia2.phi, and inertia2.w for the PID controller example. Outputs are added by searching for the name in the search bar, adding the variables of interest by checking the checkbox, and clicking "Add outputs" when done. The parameters are then added as new rows in the sheet and their units are shown, as well as their values at 'final time' of the baseline simulation.
Execute the experiment🔗
To execute the experiment (run all cases in the sheet), go to 'Experiment' mode in the add-in (right sidebar), and click the Modelon Impact play button.

During execution, the button will give some feedback on the progress. Once the simulation is finished it will write the output values to the worksheet and update the information under "Experiment Info". For dynamic simulations, the output value is the value of the variable at final time of the simulation.
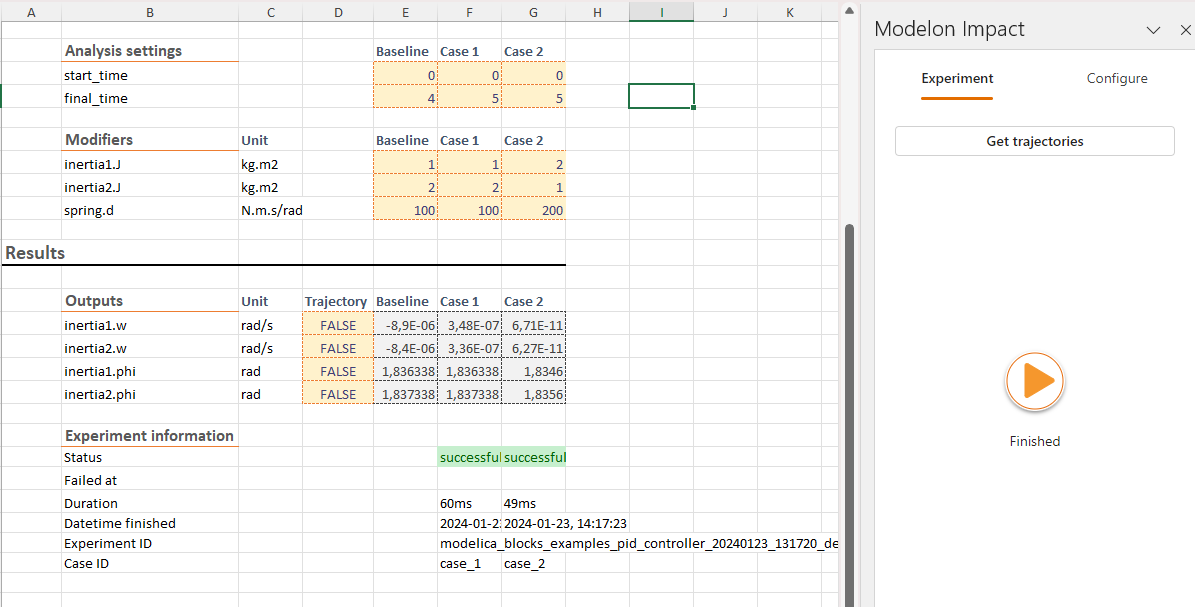
As we can see here, our two cases simulated successfully and we have the results printed to the corresponding cell.
Fetch trajectories🔗
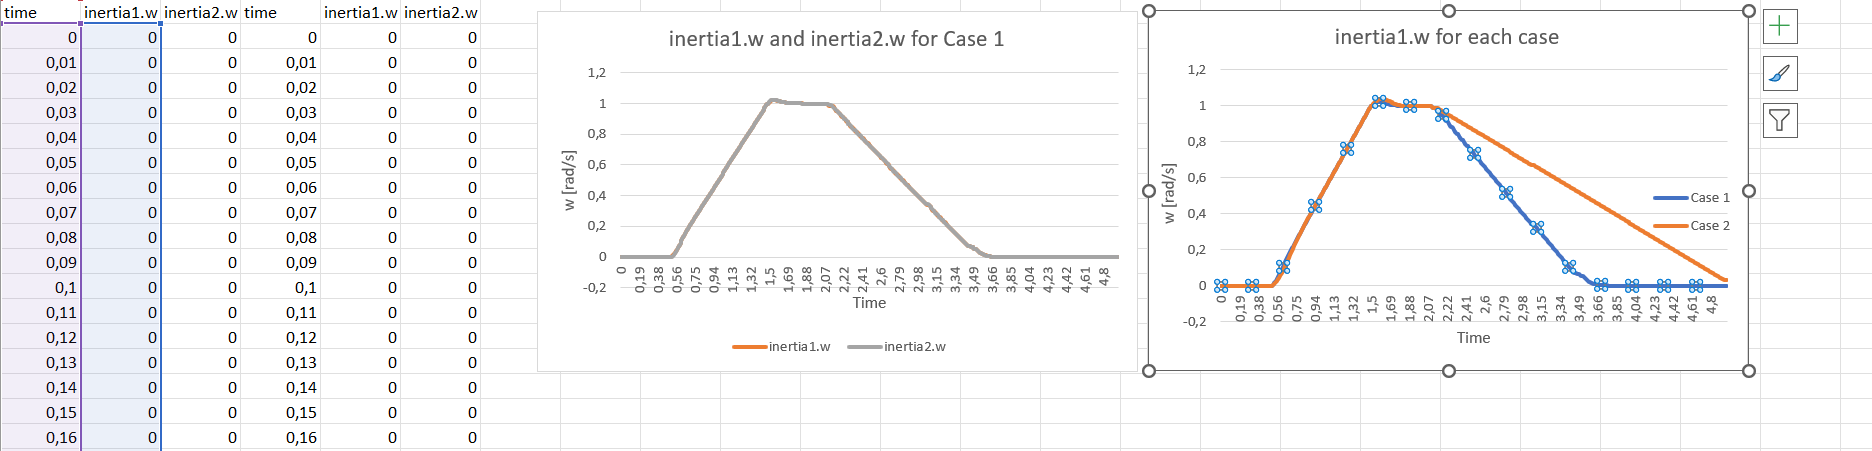
The output field for an output in the sheet only shows the final value of the variable for dynamic simulations. If you want to fetch the whole trajectory for some output variables, this can be done by switching "Trajectory" for that variable in the sheet from NO to YES, and clicking "Get trajectories" in the Experiment mode of the add-in (right sidebar). This will fetch the trajectories for all variables with "Trajectory" set to "YES" to a separate sheet in the workbook. This can be useful for detailed analysis of some variables/cases, plotting, and debugging.
For the PID controller example, try e.g. fetching the trajectories for inertia1.w and inertia2.w.
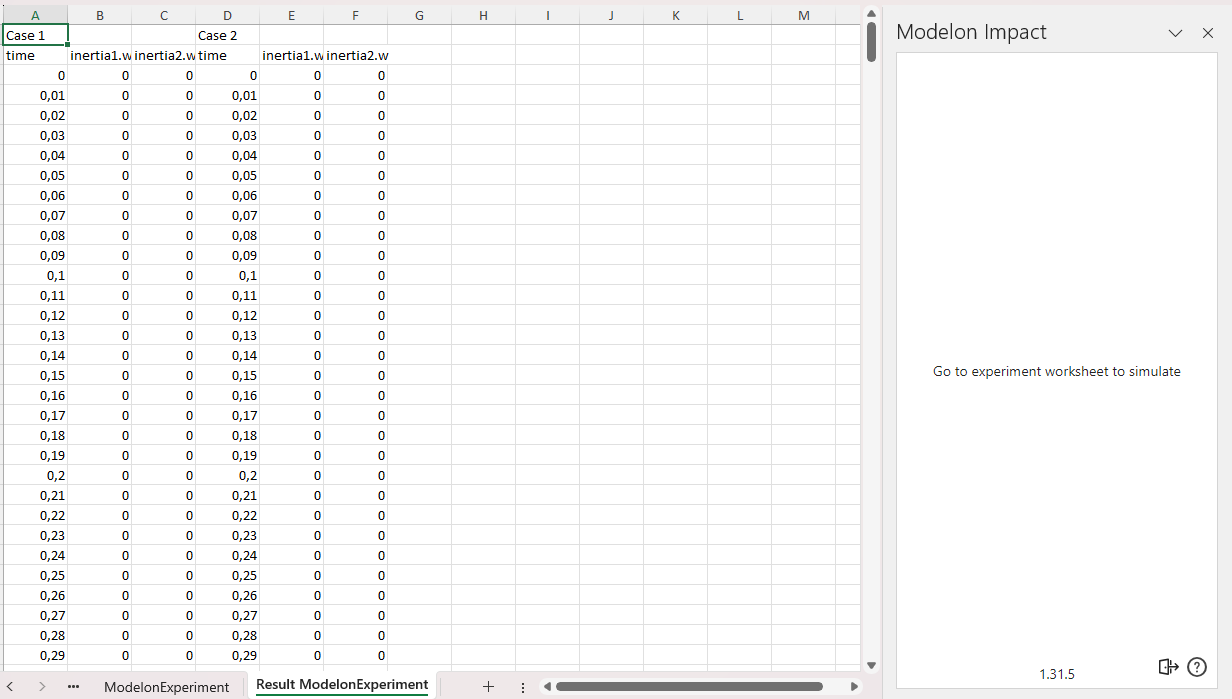
From the trajectory data sheets, plots to analyze the results further can easily be created from Excel.
This concludes the getting started tutorial!
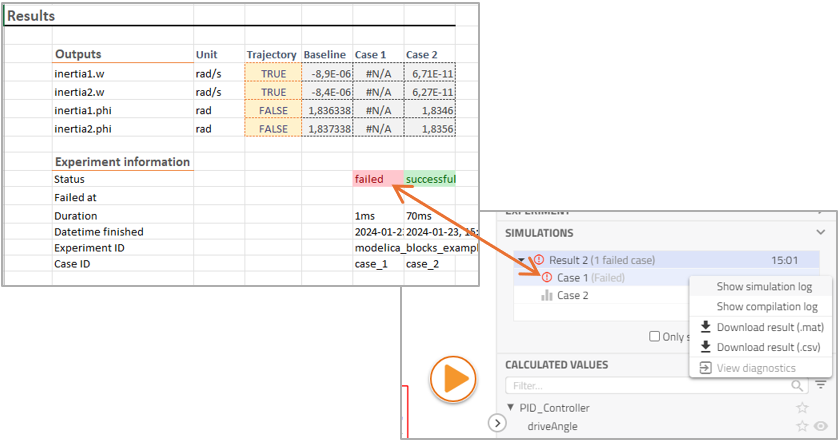
If a case fails🔗
If one or more cases fails to simulate, you will be notified by the "Status" row under "Experiment Info". In order to get more information about what went wrong in the specific case, you can always find the specific logs and results of the case in the main Modelon Impact UI. Just browse to the right model in the right workspace and you should be able to find the appropriate case in the Results mode.
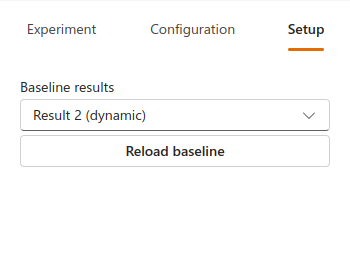
Changing baseline🔗
You may need to change the baseline configuration. To accomplish this, navigate to the "Setup" tab within the add-in. You will find a dropdown menu displaying all available results that can be used as a baseline. Select the desired result from this list, then click on "Reload Baseline" to update your configuration with the new baseline.