Solar Power Tower Rankine Cycle
Description🔗
This is an example of a central receiver concentrated solar power system, based on data of the 12.5 MW Solar Two test facility in California, USA [1].
The example addresses the engineering tasks in an early project phase likecomponent sizing and forecasting the operational behaviour of a concentrated solar power system, specifically addressing the management of temperature and pressure values for optimal power generation in a central receiver configuration.
System background 🔗
Solar Two was a solar thermal power plant that operated from 1996 to 1999 in the Mojave Desert. It was designed to test and demonstrate advanced solar power technology. The facility used a field of more than 1,800 mirrors, called heliostats, to concentrate sunlight onto a central receiver tower. The receiver tower was filled with a heat transfer fluid, which was heated to very high temperatures by the concentrated sunlight. Solar Two used a Rankine cycle to convert the heat into electricity, and one of its key innovations was the use of thermal storage to allow electricity to be generated even when the sun was not shining.
The model aims to replicate the operational characteristics of the Solar Two plant, providing users with the capability to specify operational scenarios and observe the resulting fluctuations in power generation. The control system assumes the overarching responsibility of managing the model by aligning itself with the user-defined parameters. At the top level of the control system, reference values for temperature and pressure to regulate the receiver's operation. The controller then modulates the flow to ensure that the exit temperature of the receiver and the operational pressure of the steam generator align with the specified parameters.
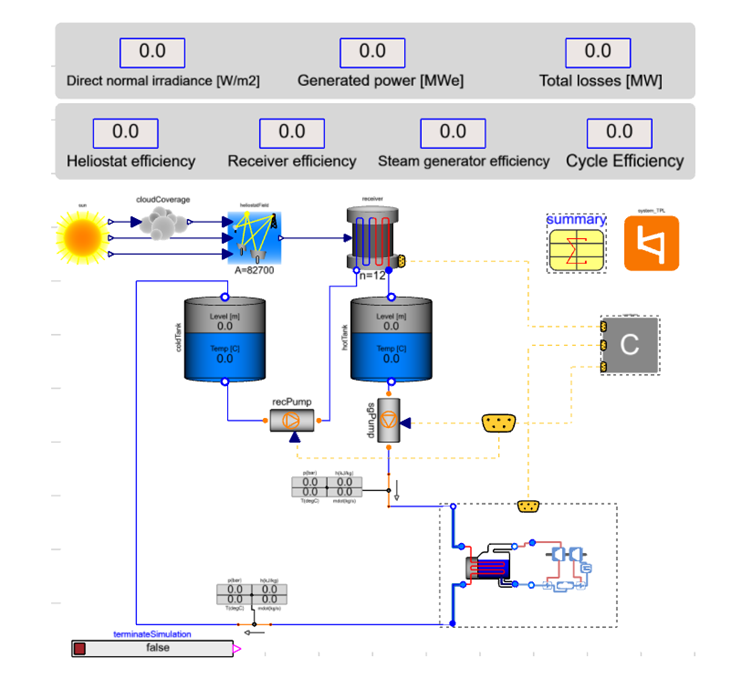
The plant model contains the following components:
- Central receiver system comprises various components, including an insolation model, heliostats, a receiver, and storage tanks. Solar salt serves as both the heat transfer medium and heat storage medium.
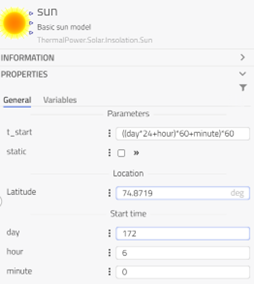
- The Insolation model incorporates models for sun positioning and cloud coverage. The sun model enables users to input location data (latitude) and starting time, which are used to calculate three outputs: solar azimuth angle, solar altitude angle, and direct normal insolation per unit area. Cloud coverage introduces enhanced system reliability, allowing users to define parameters such as the number, opacity, and duration of cloud coverage
- The Heliostat model calculates the net concentrated power using an efficiency matrix that takes solar azimuth and altitude angles into account. All losses within the heliostat field are accounted for in the input efficiency matrix. Furthermore, parameters like reflectivity, cleanliness, and receiver absorptivity can also be integrated to determine the final power output.
- The Receiver model presents a discretized representation of an external cylinder type central Receiver System with a lumped insolation input. The modelled receiver is structured with 24 panels arranged cylindrically, each panel housing 32 slender tubes for Heat Transfer Fluid conveyance. An integrated control bus facilitates streamlined access to measurement signals encompassing insolation data, inlet and outlet temperatures. Operating within normal conditions, the Heat Transfer Fluid is introduced at 290°C, with flow regulation to maintain a consistent exit temperature of 565°C.
- Comprising an integral element of solar thermal power installations, the Storage Tank assumes the pivotal role of a thermal storage system, housing the heat transfer fluid. The system incorporates two distinct tanks: the cold Tank, facilitating the transfer of heat transfer fluid to the receiver via a recPump, and the hot Tank, serving as a reservoir for pre-heated heat transfer fluid ready for circulation within the operational cycle. User-defined parameters encapsulate geometric and thermal attributes of the tank.
- Pump model encompasses both the recPump (receiver pump) and sgPump (steam generator pump), operating as flow modifiers mandating a predefined flow rate, irrespective of pressure differentials across the component. The flow rate is configurable through direct parameterization as a constant value or can be dynamically controlled through an input signal, a scheme implemented herein where the controller governs the flowrate decision process.
- Electrical power generator system consisting of a steam generator and a Rankine cycle. The steam generator operates at a pressure of 100 bar superheating the steam to a temperature of 535°C. The Rankine cycle consists of the steam turbine, two feed water heaters, a deaerator, and a condenser.
- The steam generator :The steam generator facilitated the conversion of heat from the heated molten salt mixture, energized by concentrated solar radiation, into high-pressure steam. Operating at a substantial pressure of 100 bar, the steam generator superheated the steam to a remarkable 535 degrees Celsius.
- Rankine cycle is a thermodynamic cycle used in many power generation systems, including steam turbines. Here a working fluid (typically water) is heated to produce steam, which is then used to drive a turbine and generate electricity. The steam is then condensed back into a liquid and pumped back to the heat source to start the cycle over again.
For the overall improvement of system, additional components have been incorporated into the model. The two feed water heaters are used to preheat the water before it enters the steam generator. The feed water heaters uses the low exergy steam tapped from the turbine to heat the water, which improves the efficiency of the cycle. The deaerator;is a large buffer tank used to remove dissolved gases, from the water before it enters the steam generator, and the condenser is used to cool the steam leaving the turbine and convert it back into liquid water. The control bus is used get data regarding the mass flow rate and water level and also to control the valve opening and flow rate of the working fluid.
- Control system contains several PI controllers, determining pump speeds and valve openings to keep the condenser and preheater levels in the Rankine cycle and the drum pressure in the steam generator at correct values.
- The control Bus component serves as a data aggregation point, seamlessly gathering information from both the receiver component and the working Cycle component. In addition to data collection, the control Bus also assumes an instrumental role in parameter regulation and control.
- Inside the control system, various PI controllers are integrated to ensure the precise operation and efficiency of the system:
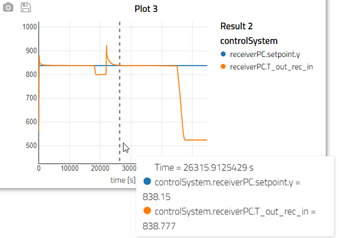
1. ReceiverPC Controller: This PI controller utilizes insolation data, receiver inlet and outlet temperatures. The setpoint temperature is configured as the desired outlet temperature, with the actual receiver outlet temperature providing feedback. Together, these inputs determine the pump mass flow rate (rec_pump_mflow) for effective system performance.
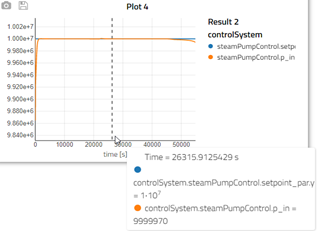
2. SteamPumpControl : Employing a PI controller, this module focuses on defining the steam generator (sgPump) mass flow rate. Its primary objective is to uphold the steam generator's operating pressure at the designated setpoint pressure.Inputs include desired setpoint pressure and current steam generator pressure.
3. BoilerLvlControl2_1: Operating with a PI controller, this element is dedicated to sustaining the boiler level within the steam generator. It takes inputs such as steam flow, feed water flow, and drum level, using these measurements to regulate the feedwater flow rate of pump_hp in the Rankine cycle.
Furthermore, the control system integrates three more PI controllers for liquid level control:
4. Hp_Preheater Control: By manipulating the valve_preheat_hp within the Rankine cycle, this PI controller regulates the liquid level in the high-pressure preheater.Input encompasses the desired liquid level in the preheater and current liquid level
5. Lp_Preheater Control: Connected to the pump_ipthat pumps the LP tapping condensate from thepreheater_LPinto the deaerator, this PI controller ensures precise control over the liquid level in the low-pressure preheater.Inputs include the desired condenser liquid level and the current liquid level.
6. Condenser Level Control: Utilizing the condensate pump (pump_Ip) that connects the condenser and preheater_LP, this PI controller maintains the liquid level within the condenser. Inputcomprises the desired condenser liquid level and current liquid level.
- These PI controllers collaboratively contribute to the comprehensive and responsive regulation of the control system, enhancing the overall performance and efficiency of the setup. Note, the three tapping valves are at aconstant opening in this model. The control valve valve_ip can be considered to control the deaerator's pressure.
- The simulation of the model is terminated if the level in the hot storage tank is lower than 0.9 meters, as this would imply insufficient insolation for running the plant, which implies that the model cannot run overnight.
- Interesting scenarios
The basic scenario in the simulation involves assessing the impact of different parameters on the performance of a solar power generation system. Specifically, the experiment explores the effects of cloud coverage, solar insolation changes due to geographical positioning, tank size variations, and control system setup on the system's behavior and power production.
- The cloud coverage plays a key role in the solar insolation; cloud parameters can be edited in the component view as below figure.
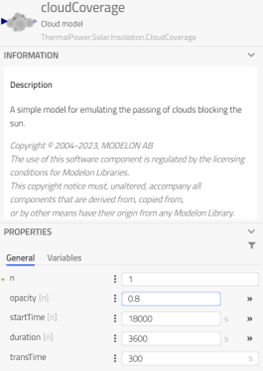
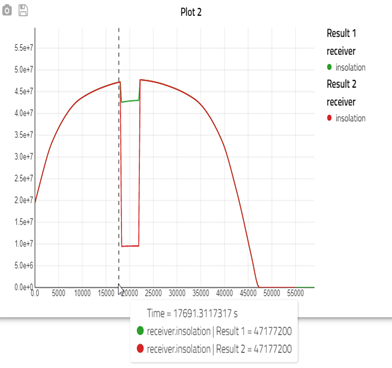
An experimentation was undertaken to assess the impact of opacity variation, where the opacity value was adjusted from 0.8 to 0.2. Subsequently, two distinct plots were generated and juxtaposed, with the green plot indicating an opacity value of 0.2. These graphical depictions vividly portray the discernible alterations in the net power reception at the receiver across the two opacity scenarios. Additionally, the graphical representation illuminates the interdependent influence of various parameters, each contributing to distinctive patterns evident within the plotted data. This scenario helps demonstrate the importance of accounting for environmental factors, like cloud cover, when designing and optimizing solar power systems.
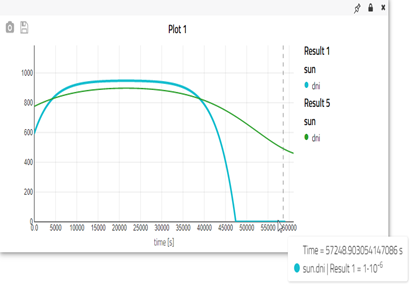
- Solar insolation changes :Geographical positioning significantly influences solar insolation. The latitude parameters can be modified within the component view, as depicted in the figure below. By adjusting the latitude value from 34.8719 to 74.8719, a substantial relocation was simulated, resulting in corresponding fluctuations in solar insolation, as illustrated in the subsequent variation.
- Tank size: Experiment with the geometrical attributes of the tank, such as height, diameter, and initial tank level, to assess the system's capacity for overnight operation.
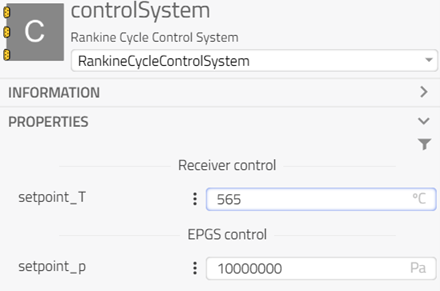
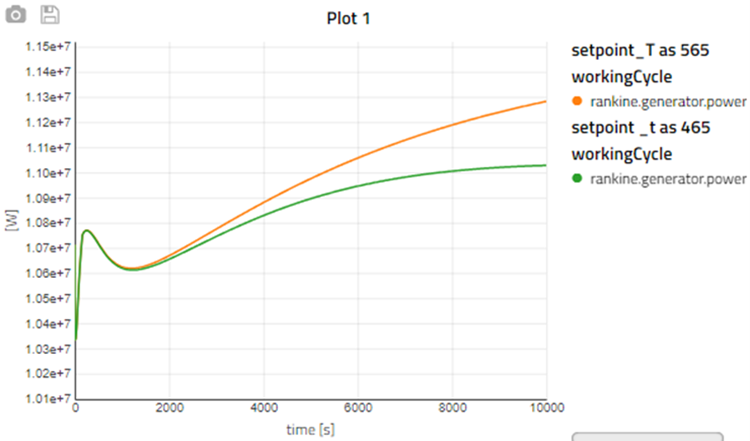
- Control setup: Within the control system, it is feasible to establish a designated set point temperature and pressure. This set point temperature signifies the anticipated solar salt temperature upon entry into the steam generator, while the set pressure represents the envisaged steam pressure upon entry into the high-pressure turbine. By manipulating these set point values, one can observe corresponding fluctuations in power production.
The engineering task behind these scenarios is to assess and optimize the performance of a solar power generation system under different conditions. By studying the impact of environmental factors, system configurations, and control strategies, researchers aim to enhance the system's efficiency, reliability, and responsiveness. These scenarios help inform engineering decisions for designing and operating solar power plants effectively in various real-world situations.
References🔗
[1] Edman J., Windahl J.:
Dynamic Modeling of a Central Receiver CSP system in Modelica🔗
Modelica 2015 Conference, Versailles, France, Sep. 21-23, 2015.
[2]BRADSHAW, ROBERT W, DAWSON, DANIEL B, DE LA ROSA, WILFREDO, GILBERT, ROCKWELL, GOODS, STEVEN H, HALE, MARY JANE, JACOBS, PETER, JONES, SCOTT A, KOLB, GREGORY J, PACHECO, JAMES E, PRAIRIE, MICHAEL R, REILLY, HUGH E, SHOWALTER, STEVEN K, & VANT-HULL, LORIN L.:
Final Test and Evaluation Results from the Solar Two Project.
United States. https://doi.org/10.2172/793226