DIAGRAM VIEW🔗
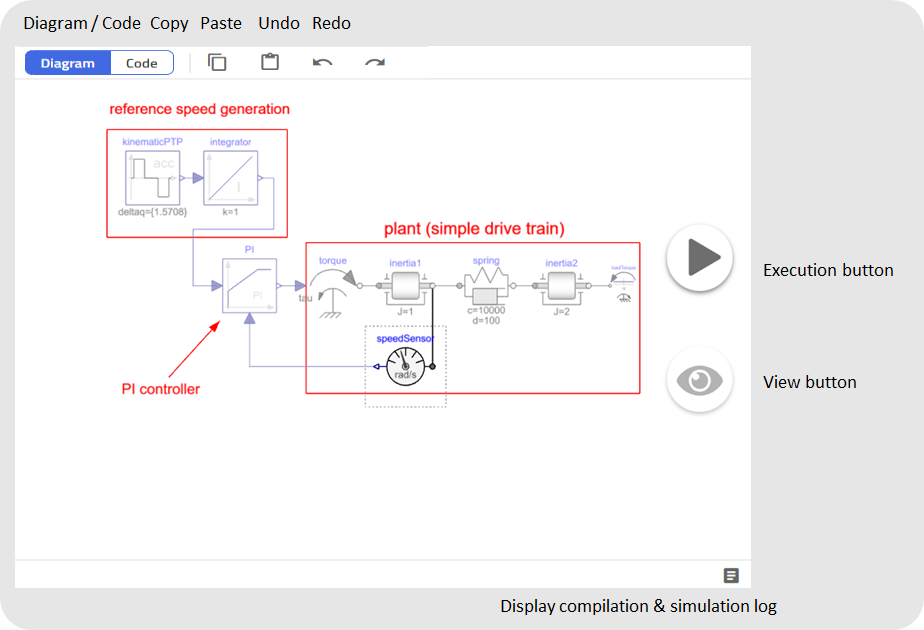
The Diagram View (also called canvas) displays the structure of the active class (model) and is always at the center as it is used to give graphical feedback when navigating, creating or editing a class.

The user can drag and drop components to the canvas and connect them to construct systems that can be simulated, executed, and otherwise analyzed.
Common editing and viewing operations such as copy/paste, resize, pan, and zoom are available when working with components on the Diagram View. You can use the scroll wheel of your mouse. In the Diagram View, the zoom focus point is the last known position of the mouse pointer.
Tip
Zoom feature is also supported through keyboard combination. Zoom in: Ctrl + +, Zoom out: Ctrl + -.
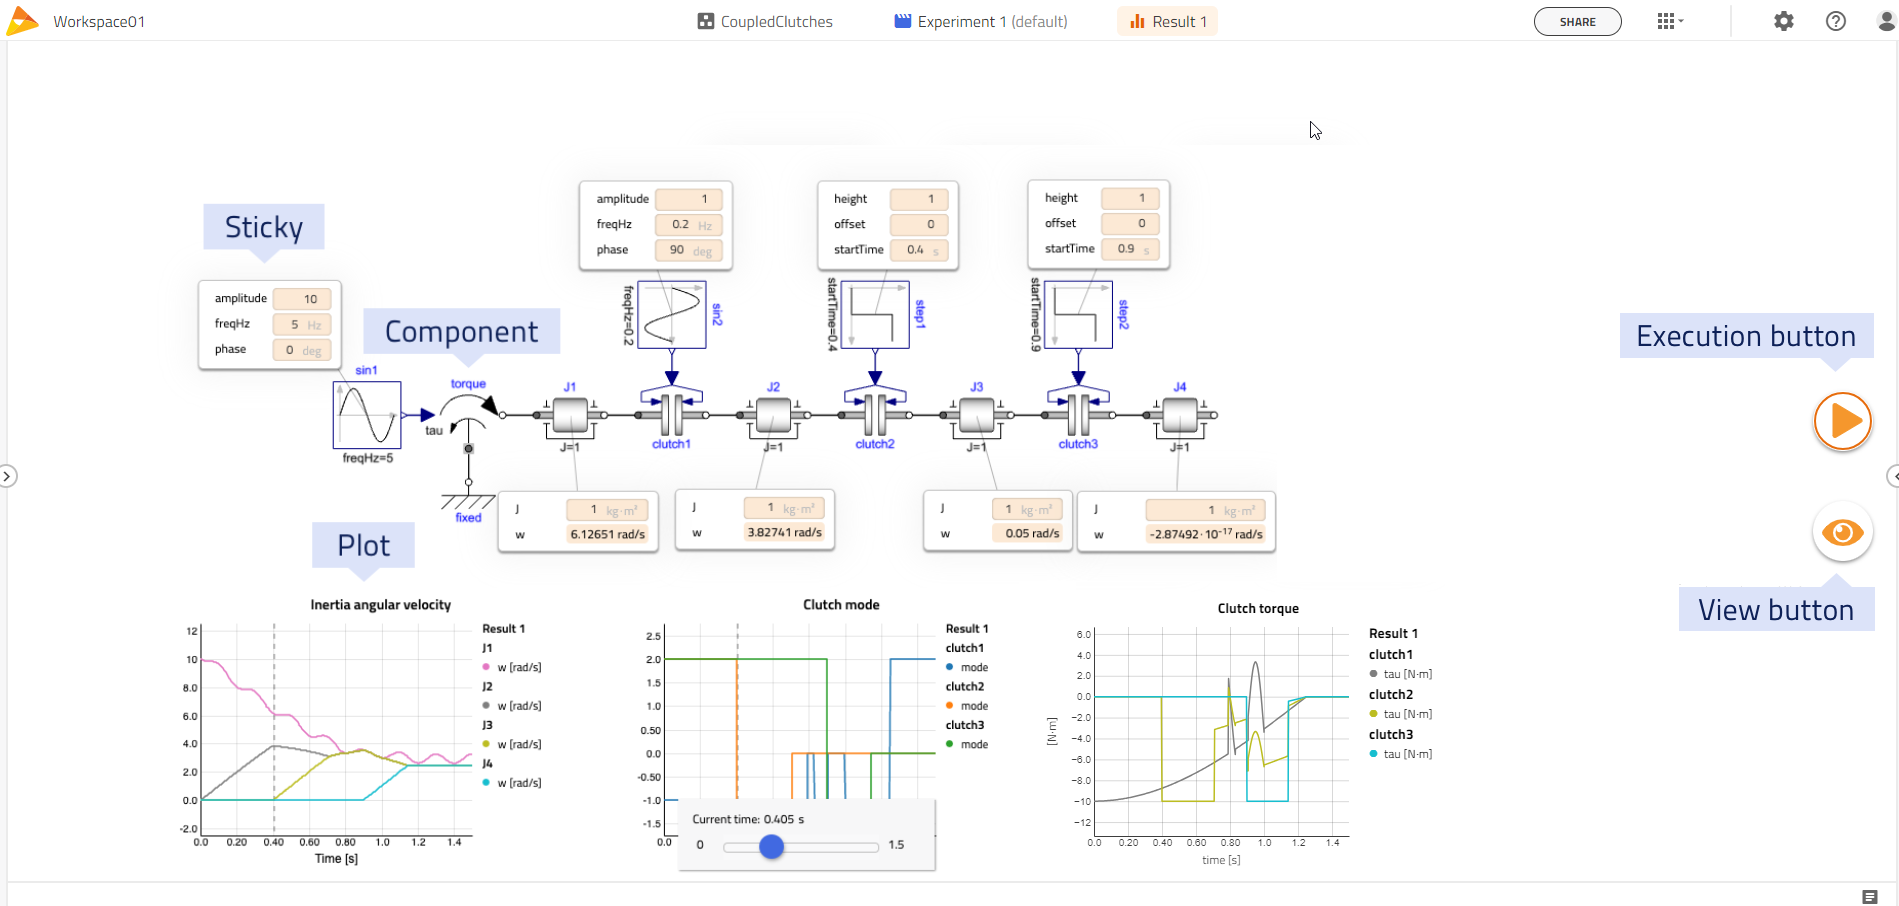
This Diagram View also serves as a backdrop during simulation and analysis as the user can interact and interpret defined Views containing plots and stickies that are associated with components on the diagram.
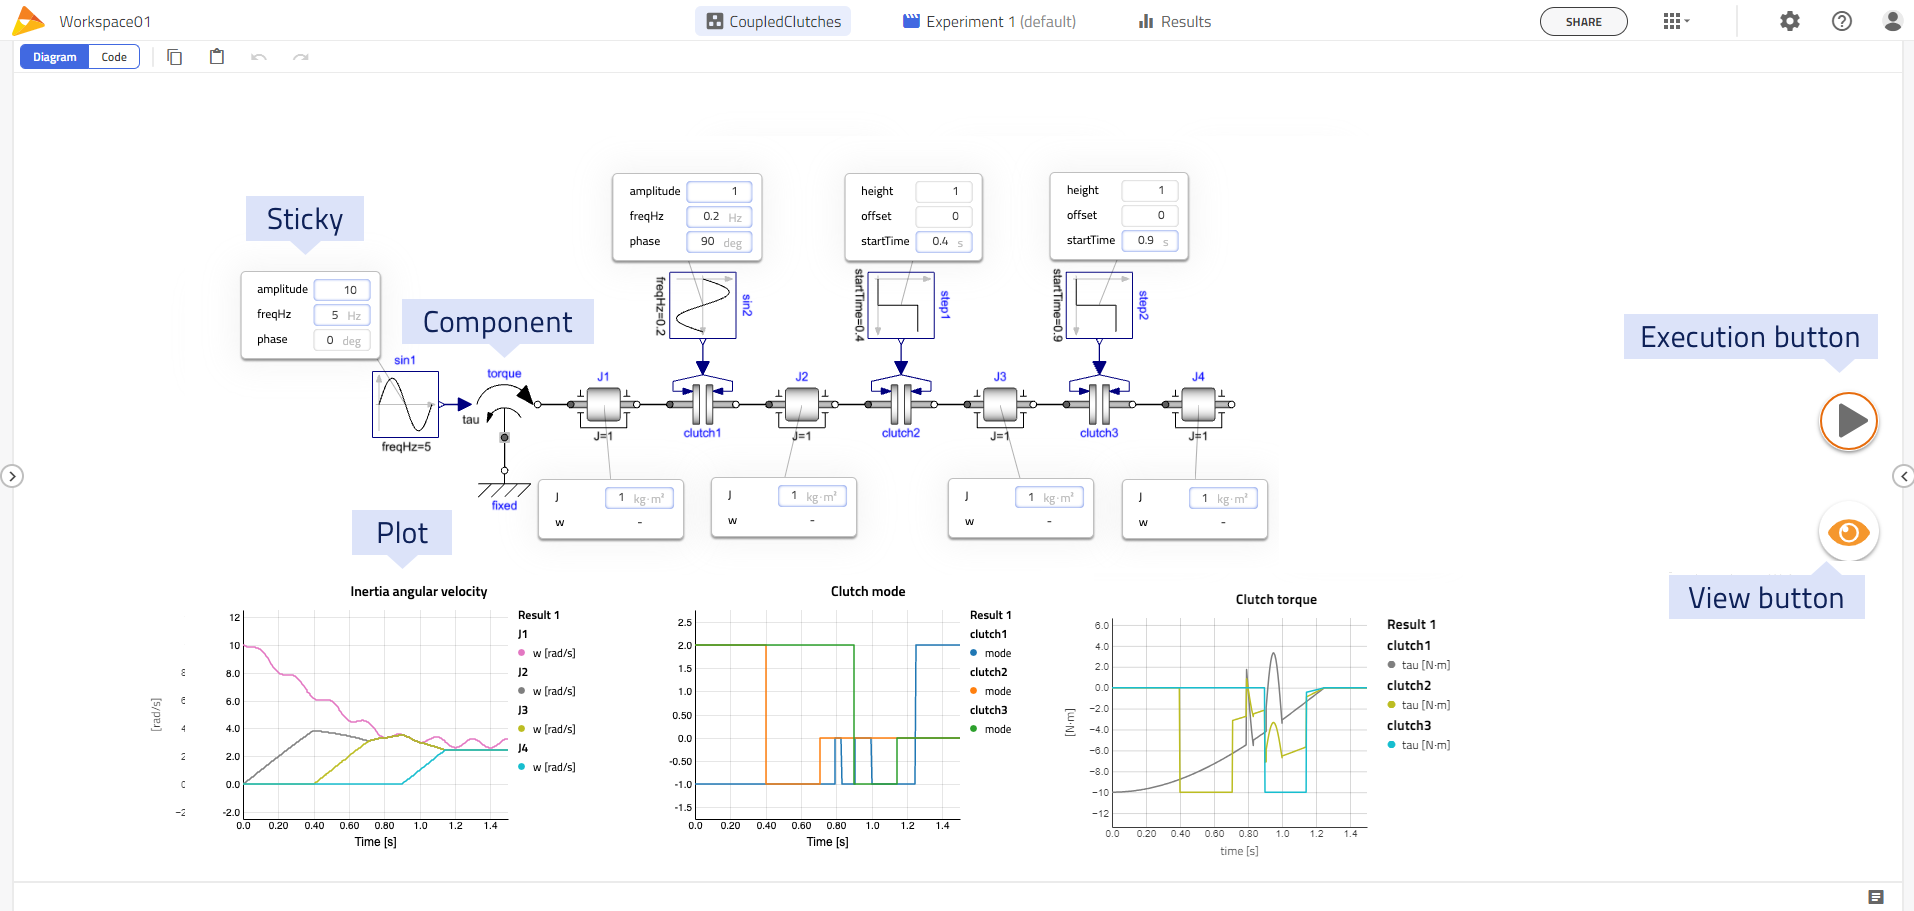
Stickies can be used to present both results from model execution and to give easy access to set parameters and other types of user input. This is what it looks like in modeling mode where parameters can be set.

Note
The input fields with a blue border indicate an input parameter that has been edited by the user.
Note
The input fields with a blue border indicate an input parameter that has been edited by the user.
And this is what it looks like after simulation.

Tip
A tutorial on how to create a model using the canvas from scratch is available in the Tutorials section.
Two action buttons floating on top of the Diagram View Execution and Views are available on the right side of the view. Each button is associated with a direct click and an on-hover drop-down to select alternative actions.
Execution button  🔗
🔗
The execution button ( run button or Play button) triggers the default experiment associated with the model. The active execution type can be changed in the sub-menu of the execution button.
Tip
Holding SHIFT and clicking on the execution button will force a new compilation and create a new FMU for the simulation.
Custom Views🔗
View button  🔗
🔗
A custom View is a defined set of plots and stickies for a model used to provide a canvas-oriented interface to the model with suggestions for commonly used parameters and relevant output variables suitable for analysis of the model. A custom View can be thought of as a kind of dashboard of a model. This includes what variables are plotted/shown in stickies as well as the positioning of plots and stickies.
Views can be created both for editable as well as read-only models as they are stored as separate objects in your Projects. The Views are saved in the context of the active Projects (for editable models) or the default Project (for read-only models) (cf. Workspace concept). The Eye button toggles the default system View on and off. If no custom View exists, it will toggle all component Views on/off.
The drop-down allows to select other preconfigured Views or to open the right panel to access all the details.