DETAILS PANEL  🔗
🔗
The details panel is located to the right in the application and is comprised of seven (7) tabs:
Depending on which mode is active, different tabs are made available.
For more information about which tabs are available in which modes, please see the Navigation bar.
A tab, which is a part of the panel serving a specific purpose, can be expanded and collapsed by clicking on its frame.
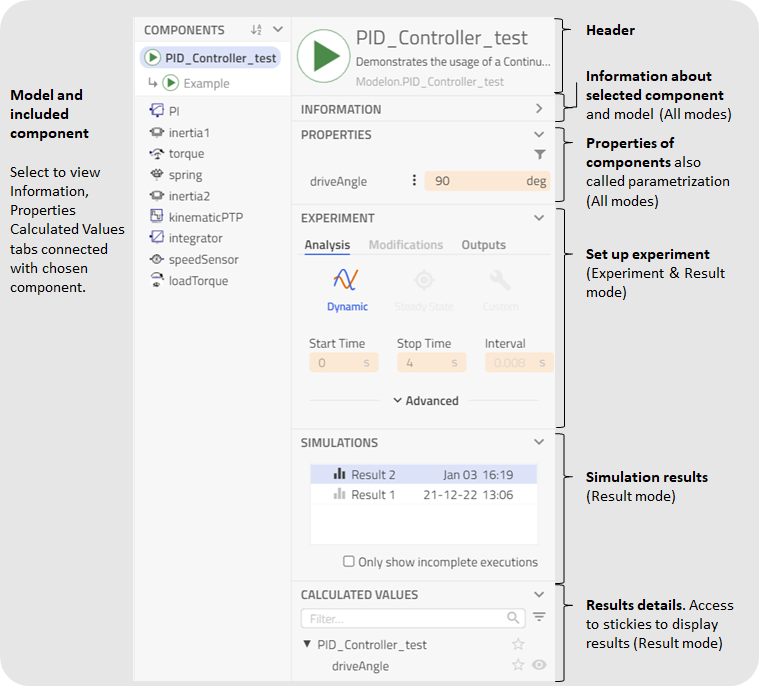
Header🔗
The header section on the top of the panel displays the name and icon of the active model/class or selected component. Here, you find information about the class itself and what class the model has. If no component is selected, the header will display the active class. If the model displayed in the header is writeable, you can click on its name to change it. If it is replaceable, you can use the class name drop-down menu to change the class.
Information🔗
The information tab displays the documentation associated with the active model or selected component.
Note
This documentation is stored within the Modelica code.
Properties🔗
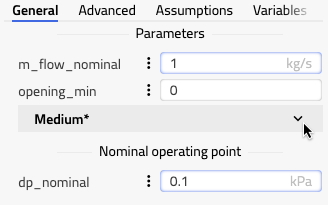
The properties tab is used to configure the active model or selected component by setting parameter values in the input fields and redeclare replaceable components.
The tab is structured in sub-tabs and groups according to the model definition (Modelica's Dialog annotation).
Furthermore, it also contains values calculated during simulation. These can appear in any sub-tab/group depending on how the model is set up, but can typically be found under the Variables tab.
Note
Parameters in record array components cannot be edited using the Properties tab. Click here to find out how to edit such parameters.
Components that are replaceable or have specifically been configured to do so will also appear in the Properties tab.replaceable components can be changed to a different class by using the drop-down menu, and parameters of a component can be seen and modified by expanding the component using the expander icon to the right of the name as shown in the image below.
Some properties of a model are not displayed in the Properties tab:
protectedparameters, variables and components: When something is declared asprotectedit means that the model developer has actively chosen to hide the parameter/variable/component. Furthermore, it is not allowed to reference them outside of this class.disabledparameters: The user may choose to display disabled parameters in Settingsfinalparameters: When a parameter has been set asfinalit means that it cannot be changed. You may choose to displayfinalparameters in Settings. For most users, it is a good choice to keep the defaultfinaloption for hiding parameters, as it helps to condense the list of parameters and highlight only the important ones.
Properties Attributes ![]()
The user can set attributes of a parameter or variable by clicking the vertical ellipsis between the name and the value field.
The content of the attributes will depend on the type of the parameter/variable. Changes done to the attributes will be indicated by a highlight of the vertical ellipsis color.
Properties Filter ![]()
The filtering is accessed by pressing the funnel icon just below the Properties tab frame. Filtering can be done by category:
- Start values
- Favorites
- Stickies
- Modified parameters
- Keyword
Furthermore, the user can expand the filtering type by pressing the icon just right of the keyword input field which will show available types to filter on.
Note
The filter in Properties only applies to the current hierarchical level and not to sub-components.
Components🔗
The Components tab lists all components in the active model. Typically, this list corresponds closely to what is shown in the Diagram View but might include components that are not shown graphically there.
The list is displayed in order of declaration, but the user may choose to sort by alphabetical order to quickly find a component of interest. Selecting a component in the list will display its header and properties and the corresponding component will be selected in the Diagram View.
Double-clicking on a component in the component list is a shortcut to perform the 'Inspect component' function, which opens its content in the context of the instance within the model in the Diagram View.
Experiment🔗
The Experiment tab contains everything related to an experiment. In the upper part of the tab, there is a list of available experiments. Experiments can be added by pressing the + New experiment link. Experiments are saved automatically as soon as they are modified.
Tip
Experiment's parameter modifications or analysis settings can be applied to a model, resulting in content of the Experiment being saved in the Modelica model. This can be done by right-clicking an Experiment in the list and selecting Apply to model or Apply to the new model.
Note
The only analysis settings that can be applied to the model are the dynamic solver, the StartTime, the StopTime, the Interval, the solver Tolerance, the solver step size (for ExplicitEuler solver), and the solver type (CVode, ExplicitEuler, ...).
Experiments in the list can be activated or deactivated by clicking on them and it is also possible to create, duplicate, rename, and delete Experiments, using the context menu. When an Experiment is active, the layer tab on top of the canvas is shown with a blue icon and the name of the Experiment. This means that if a simulation is executed the simulation will be used (regardless of what mode is active). Only one Experiment can be active at a given time.
There are three sub-tabs where different aspects of the experiment can be configured.
Experiment Analysis
In the Analysis tab, you can decide what kind of analysis is to be used for execution and any related settings.
The available analyses are outlined below. Analysis settings not shown below the respective analyses can be found under the Execution settings.
Experiment Modifications
The Modifications tab shows all parameter modifications in the Experiment. Any modification can be removed by clicking the X to the right of the entry.
The Modifications tab is read-only, so to add or change a modification, you will have to access the respective parameter shown in the list in the Properties tab or use a sticky.
Experiment Outputs
Reduce the number of variables stored in a result, by using the Output tab to add filters, in order to save storage. By default, all variables except protected variables are included. To limit the stored variables, please click + New filter and select a type of filter, and depending on the type define it:
- Text: Enter the filter string according to the global format programming, e.g. summary to keep all variables containing the string 'summary'.
- View: Select an existing View or the current View where the latter means all stickies and plots currently displayed on the canvas. This means it will also change if the shown stickies and plots are modified. All variables displayed in stickies and plots in the chosen View will be kept in the result.
Output filters can be removed by clicking the X.
Experiment types
- Dynamic
This will enable dynamic simulation where the user can set:
- *Start time* (default: *0 s*)
- *Stop time* (default: *1 s*)
- *Interval* (default: *0.002 s*)
- *Points* (default: *500*)
- Solver (default: *CVode*)
- *Tolerance* (default: *1e-6*, only available for *CVode* or *Radau5ODE* solver)
- *Step Size* (default: *0.01 s*, only available for *ExplicitEuler* solver)
Note
You can enter either Interval or Points (toggle). The values can be calculated into each other:Points = (StopTime - StartTime)/Interval
-
Steady-State This will calculate the steady state solution of the model taking any PbS (Physics-based Solving) annotations into account.
-
Custom Available custom analyses will appear in a drop-down list under the Custom button. Arguments for the chosen custom analysis, if any, will appear below the drop-down.
Simulations🔗
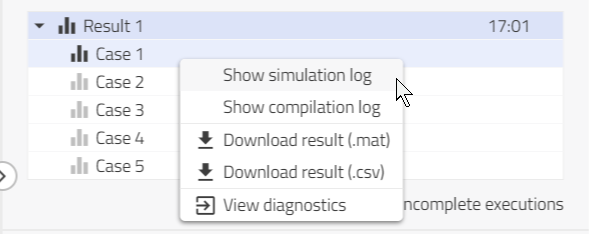
The Simulations tab lists the execution results of the active model including timestamps indicating when the simulation was performed. You can select a result to inspect its content in the tabs Properties or Calculated values. If a compilation or simulation has failed, there will be an entry with an error symbol saying 'Compilation error' or 'Simulation error', depending on what went wrong. It is possible to access the simulation and compilation log from the context menu (also for failed simulations and compilations), which is accessed by clicking the ellipsis icon in a given result list entry.
You may rename a result by clicking on the pen icon next to the name or remove it by clicking the X to the right of the filter entry.
In the case of multi-simulation, simulation and compilation logs can be viewed for individual cases.
The Calculated values tab will display the content of a result chosen under Simulations as a tree structure corresponding to the model hierarchy.
It contains the same information as the Properties tab but is presented without considering tabs and groups.
Artifacts🔗
The Artifacts tab becomes visible when your project generates additional files from custom functions or Modelica code.
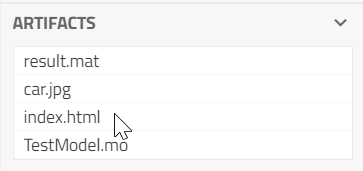
This section is designed to help you manage these files, which are of two types:
- Modelica Files: These are Modelica files that you can incorporate into your project for further development or use.
- Resource Files: These files include supporting materials such as data sets or images that belong in your project's resource directory.
For each artifacts following actions are available if applicable:
- Preview: If your browser supports the file format, you can view the artifact in a new tab. Otherwise, this option won't be available.
- Download: This action allows you to save the artifact.
- Copy: This option allows you to add the artifact to your project, placing it in either the source code or resources directory, depending on the file type.
Note
The "Copy" action is not available in App Mode.
Calculated values🔗
Shows calculated values of parameters for the selected simulation result. The tab includes a filtering function.