Plots🔗
Plots and visualizations are built into Modelica Impact to display the results of simulations more intuitively and comprehensively.
To create plots after the simulation, you should typically need to follow these steps:
-
Create a plot by dragging a variable from the result browser into the model canvas.
-
A new plot is created if the variable is dragged to the canvas.
-
If dragged onto an existing plot the variable is added to the same plot. It’s also possible to drag variables between plots.
-
The color of individual plots can be changed. Hover the cursor over the dot to the left of the name of the plot. Left-click to see the menu option. Choose a Line color.
-
Click and drag the mouse over the plot to augment the view. Repeat to further augment the view.
-
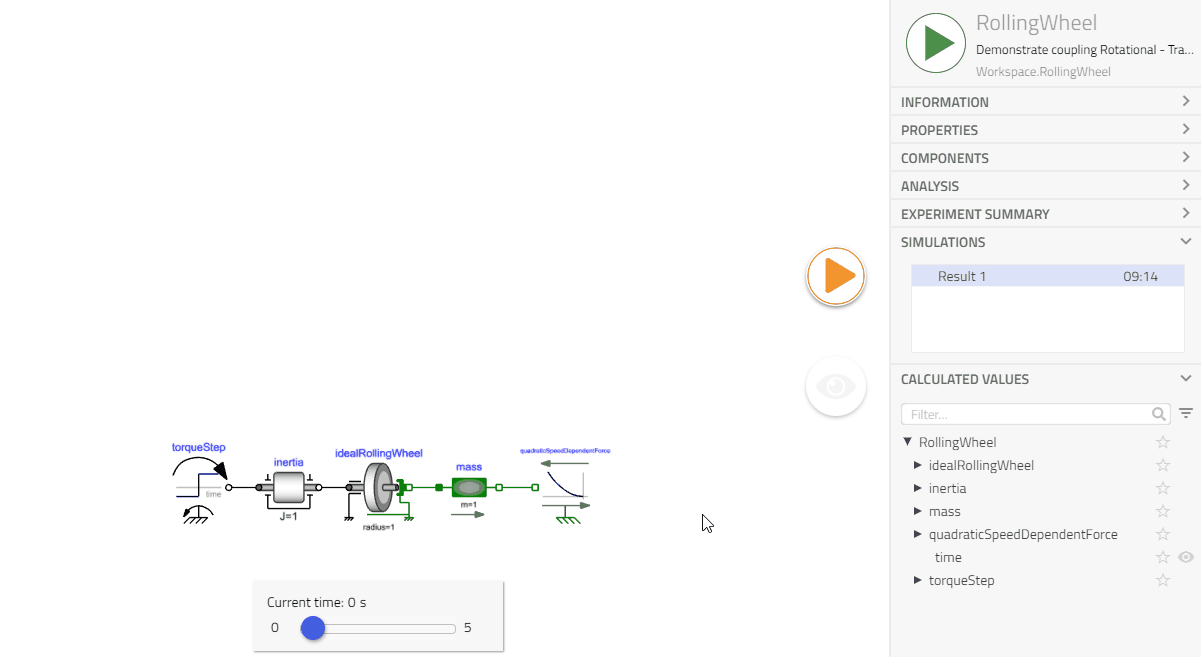
The Time Slider at the bottom of the canvas can also be used to show a line marker in each plot.
-
A plotted variable can be removed by clicking the
 button near its legend.
It is possible to hide the legends (when not hovering) in a plot window by pressing the
button near its legend.
It is possible to hide the legends (when not hovering) in a plot window by pressing the
 button.
Create plots automation
Pin Plots🔗
Pin plots help compare results between different models. Pinned plots remain on the canvas when switching between models. The legend will include the model name for the origin of the plotted variables.
- Click on the pin icon
 to retain a plot in the canvas.
Related articles🔗
Visualize Results | Stickies | Animation | Result Size | Sliders | UI | Download Result | View Result